Apple launches Apple Store app in India

The Apple Store app provides customers with the most personalized way to shop for Apple’s innovative lineup of products and services. Learn more >

You can make a difference in the Apple Support Community!

When you sign up with your Apple Account, you can provide valuable feedback to other community members by upvoting helpful replies and User Tips.

Looks like no one’s replied in a while. To start the conversation again, simply ask a new question.

Numbers, auto populate data based on pop up menu answers

Hi,


I have a spreadsheet that includes all items for expenditure and income. The last column of the sheet I have created a pop up menu of the location.


I would like to create separate sheets for each pop up menu location so that they can be analysed individually. Is there a way that the data can be pulled across to the individual sheets based on the pop up menu name?


Thanks,


Lloyd


iMac 27″, macOS 12.4

Posted on Jun 8, 2022 5:20 AM

Reply
Question marked as Top-ranking reply

Posted on Jun 8, 2022 5:54 AM

There are multiple different ways to do this, here a simple option


You have a table with all the main data and for each property you create a new table

Columns A, B and E of the property tables have a simple formula, they just show the value that is in columns A, B and E of the main table.
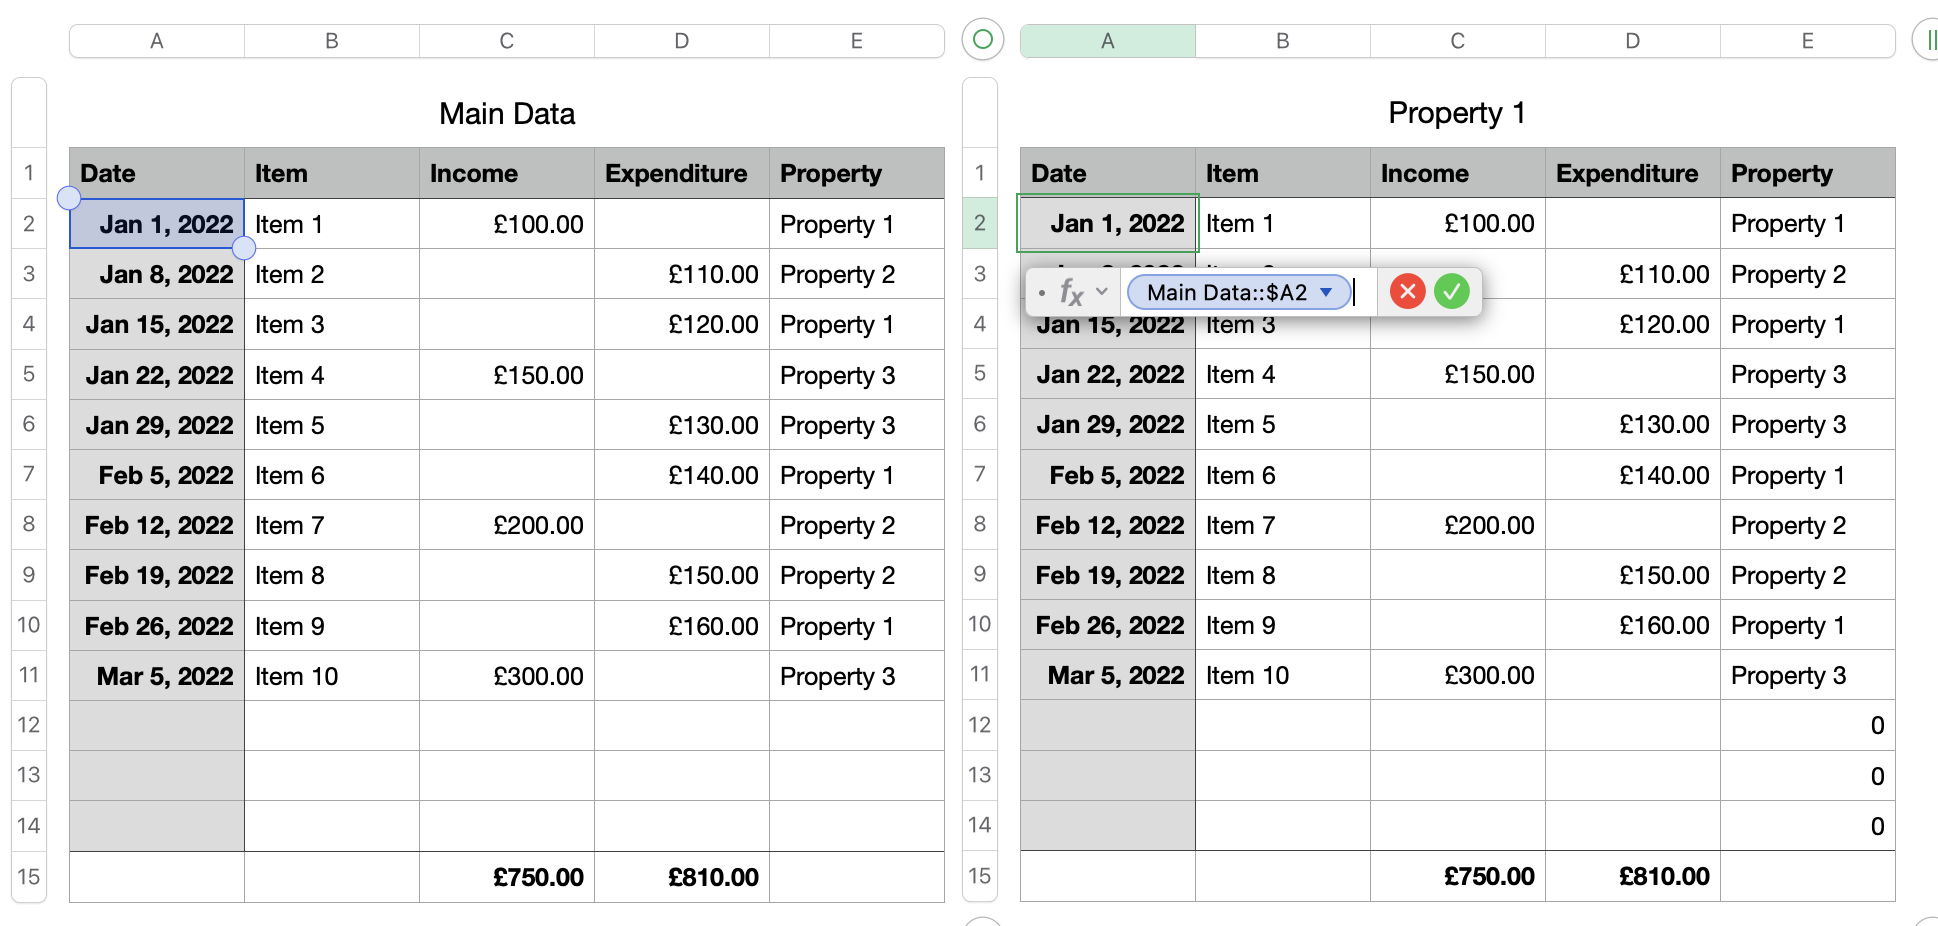

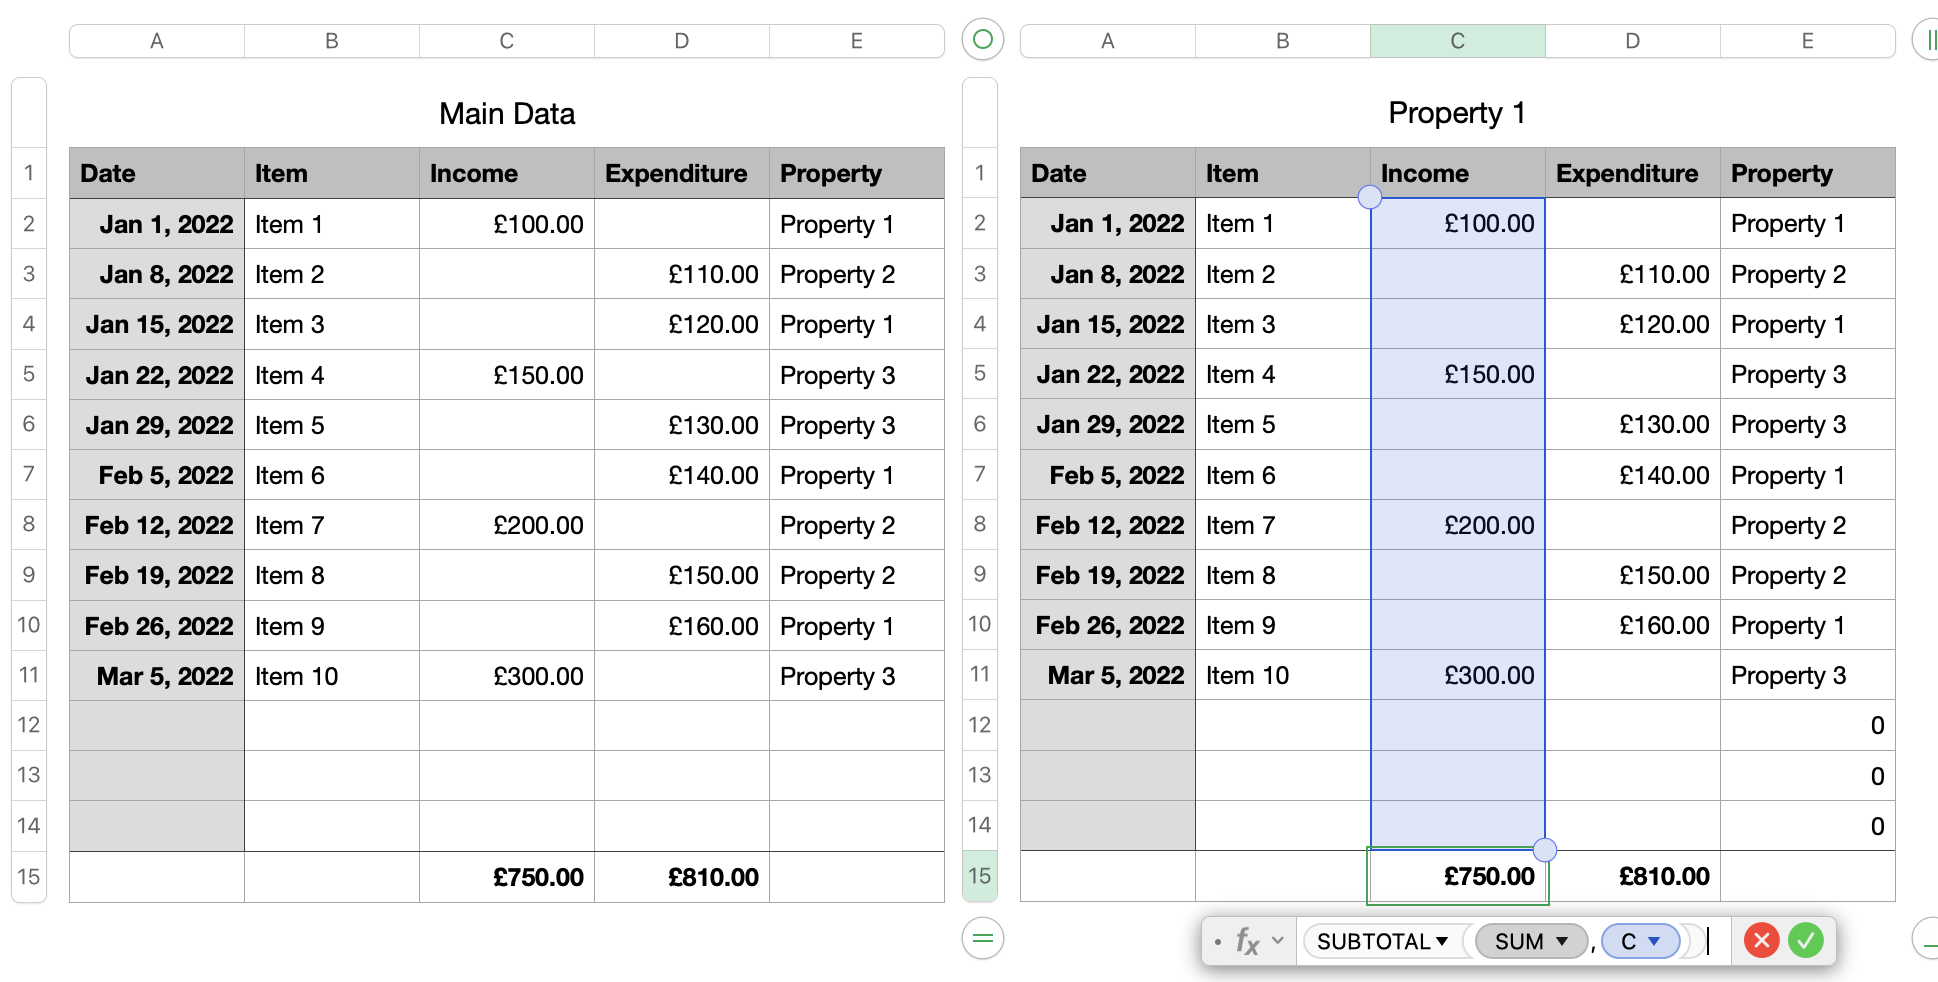
Column C and D will check if the columns in main data are empty or not and write only the value if it is above 0.


Total for column C and D is created by SUBTOTAL and not with SUM

SUBTOTAL will only use visible values!

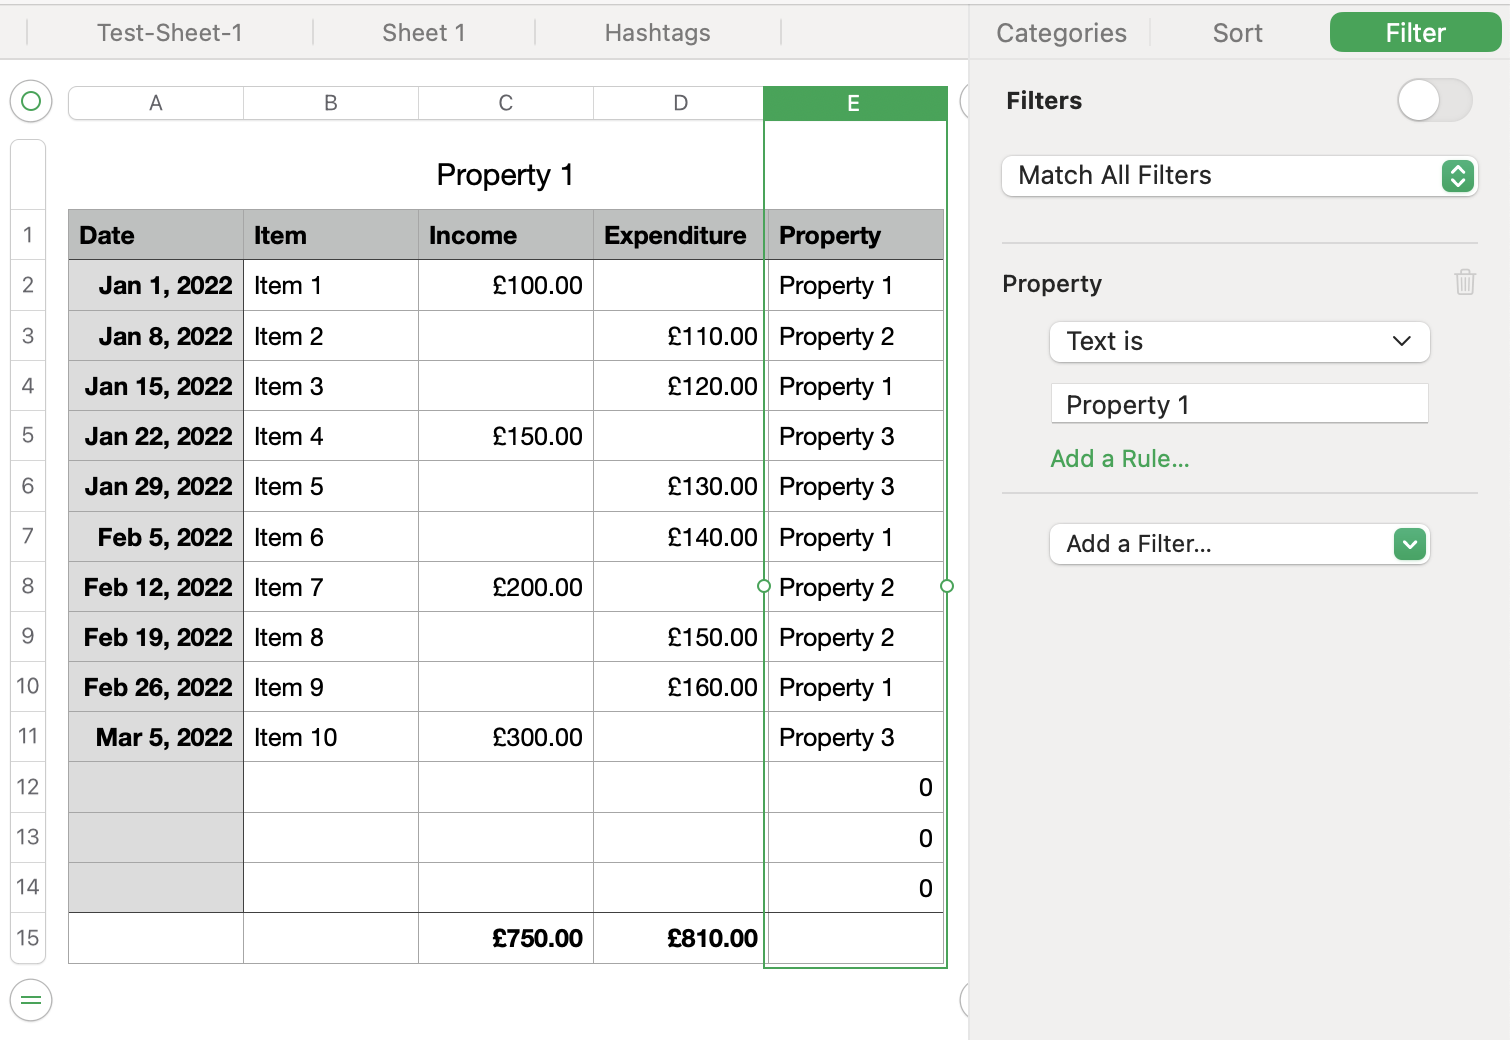
Now create a filter that will display only rows if column E contains the text Property 1

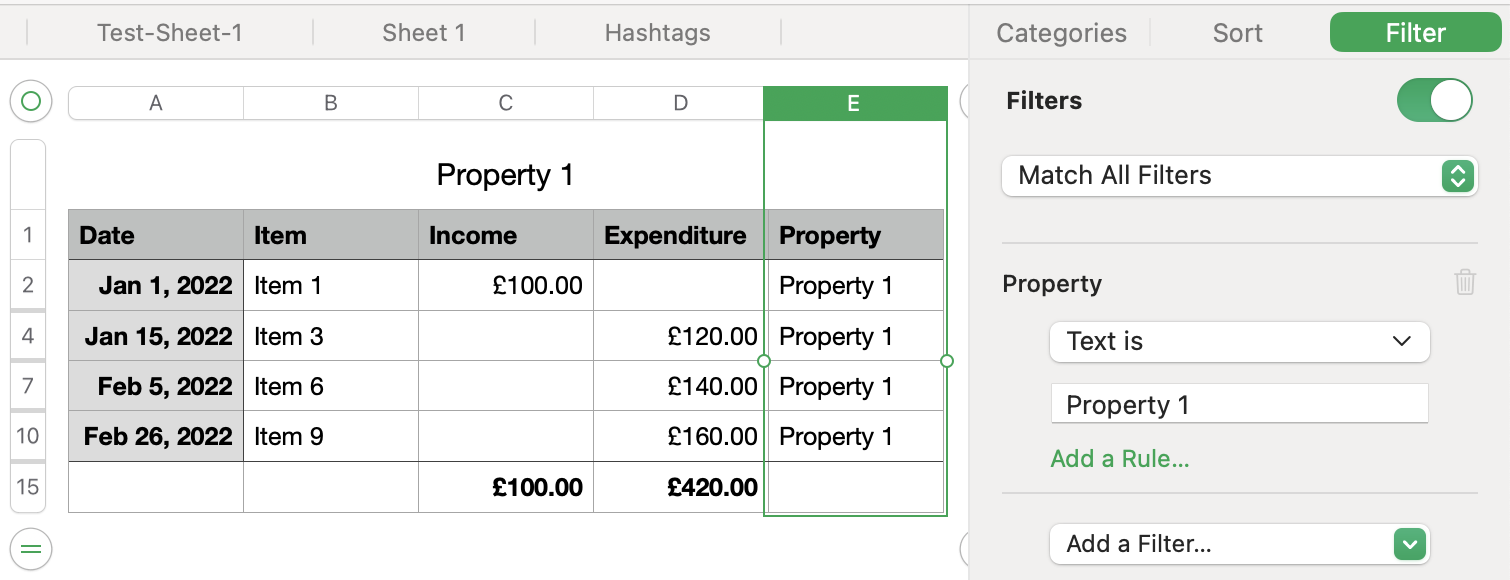
As soon as you activate the filter you will only see data from Property 1 and the totals are also correct

You must ensure that all tables have the same number of rows, if not you could loose information because they will not fit in the needed table.


Based on your region the , or the ; will be used to separate the different sections of a formula.


Hope this will solve your question, please let me know if something in unclear.


Ralf

Similar questions

4 replies
Question marked as Top-ranking reply

Jun 8, 2022 5:54 AM in response to Lloydturner

There are multiple different ways to do this, here a simple option


You have a table with all the main data and for each property you create a new table

Columns A, B and E of the property tables have a simple formula, they just show the value that is in columns A, B and E of the main table.


Column C and D will check if the columns in main data are empty or not and write only the value if it is above 0.


Total for column C and D is created by SUBTOTAL and not with SUM

SUBTOTAL will only use visible values!


Now create a filter that will display only rows if column E contains the text Property 1


As soon as you activate the filter you will only see data from Property 1 and the totals are also correct


You must ensure that all tables have the same number of rows, if not you could loose information because they will not fit in the needed table.


Based on your region the , or the ; will be used to separate the different sections of a formula.


Hope this will solve your question, please let me know if something in unclear.


Ralf

Jun 8, 2022 6:58 AM in response to Lloydturner

Lloydturner wrote:

Is there a way that the data can be pulled across to the individual sheets based on the pop up menu name?


Generally it's inefficient to "pull" data into individual tables (not sheets; sheets in Numbers have a blank canvas, on which you place tables and other objects).


You might consider keeping the data in one table the way you have it and just spend a few minutes to get a Pivot Table to extract and summarize data from it.


For example, something like this can be produced in less than a minute using no formulas, just a few clicks and drags:


Or quickly do another drag to get this, results by month:


Or... well the possibilities seem endless, with just a few clicks and drags.


You can have several Pivot Tables based on the same data, one Pivot Table per property if you like the look of that better.


To start a Pivot Table just click in the table with the data and from the menu choose Organize > Create Pivot Table > On Current Sheet.


Much easier than worrying about pulling subsets of data in to separate tables for analysis.


SG


Numbers, auto populate data based on pop up menu answers

Welcome to Apple Support Community
A forum where Apple customers help each other with their products. Get started with your Apple Account.