Apple launches Apple Store app in India

The Apple Store app provides customers with the most personalized way to shop for Apple’s innovative lineup of products and services. Learn more >

You can make a difference in the Apple Support Community!

When you sign up with your Apple Account, you can provide valuable feedback to other community members by upvoting helpful replies and User Tips.

Looks like no one’s replied in a while. To start the conversation again, simply ask a new question.

Why is Numbers bar chart wrong?

Why is Numbers not able to create the most simplistic of charts from the data fields?

I have attached a screenshot of what I have created, but I can't understand why a total of 3 shows past the '3 line' and the total 1 doesn't even reach the '1 line'. Shouldn't they all display like the '5 line'?

Am I missing something, or is Numbers just that bad?


iMac Pro

Posted on Apr 3, 2020 2:20 AM

Reply
Question marked as Top-ranking reply

Posted on Apr 3, 2020 2:51 AM

Hi MrSalter,


Well, you are missing something, but what is wrong is just as bad as what you thought was wrong.


The bars, measured from the category axis to the tip of the rounded end are in the correct proportion.


But there's something amiss about the vertical scale lines—number 2 has gone AWOL.


Here's a screen shot, talke from your post above.


I pasted it into a Numbers document, then made a single row, five column table, placed it on top of the chart image, placed the left margin of the first column on top of the category axis, and dragged the handle at the center of the right margin of the fifth column right to sit on the scale line labeled '5'.


Note that each of the column borders line up quite well with the tip of at east one bar.


Then take a look at the value axis at the bottom of the chart (inside the red loop), and the lighter grey scale lines running up from that axis.
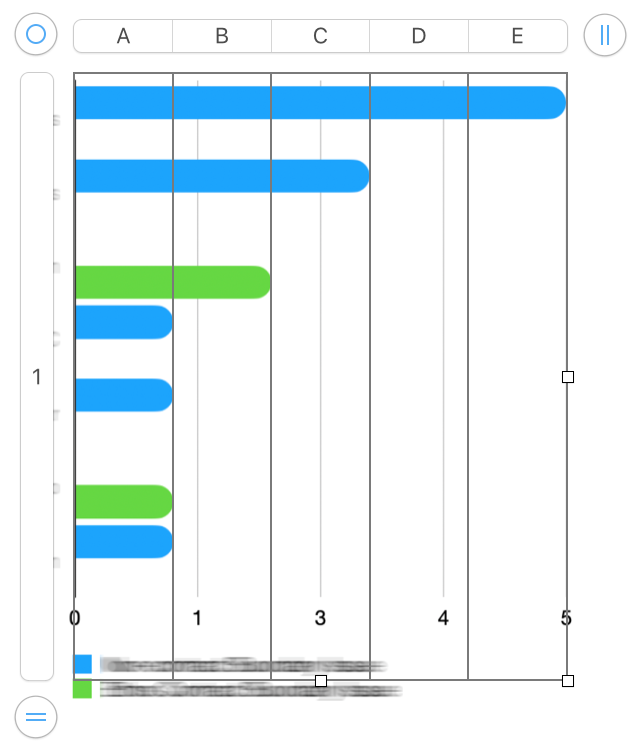

Adding one more step to the value axis scale should improve matters.


Regards,

Barry

2 replies
Question marked as Top-ranking reply

Apr 3, 2020 2:51 AM in response to MrSa1ter

Hi MrSalter,


Well, you are missing something, but what is wrong is just as bad as what you thought was wrong.


The bars, measured from the category axis to the tip of the rounded end are in the correct proportion.


But there's something amiss about the vertical scale lines—number 2 has gone AWOL.


Here's a screen shot, talke from your post above.


I pasted it into a Numbers document, then made a single row, five column table, placed it on top of the chart image, placed the left margin of the first column on top of the category axis, and dragged the handle at the center of the right margin of the fifth column right to sit on the scale line labeled '5'.


Note that each of the column borders line up quite well with the tip of at east one bar.


Then take a look at the value axis at the bottom of the chart (inside the red loop), and the lighter grey scale lines running up from that axis.


Adding one more step to the value axis scale should improve matters.


Regards,

Barry

Why is Numbers bar chart wrong?

Welcome to Apple Support Community
A forum where Apple customers help each other with their products. Get started with your Apple Account.