There's a lot there to unpack, and a lot depends on the way you're structuring your data.
First off, though:
> Will I have to create a totally different document in order to have them linked
Absolutely not. Numbers does not support automatic links across documents, only between tables and sheets in the same document, so everything needs to be in a single document.
Secondly, without seeing your data, this sounds like a perfect use case for a pivot table.
In this setup, you create one 'master' sheet for all your transactions, regardless of date, category, etc.
You then create a pivot table to automatically categorize and summarize the data. Numbers can automatically collate all the transactions by category, date (including by year, month, quarter, etc.) and give you subtotals.
You can either create separate pivot tables that are limited by month, or you can one main pivot table and use filters to limit the data to specific months/years/etc. (including categories if you just want to see how specific categories have changed over time).
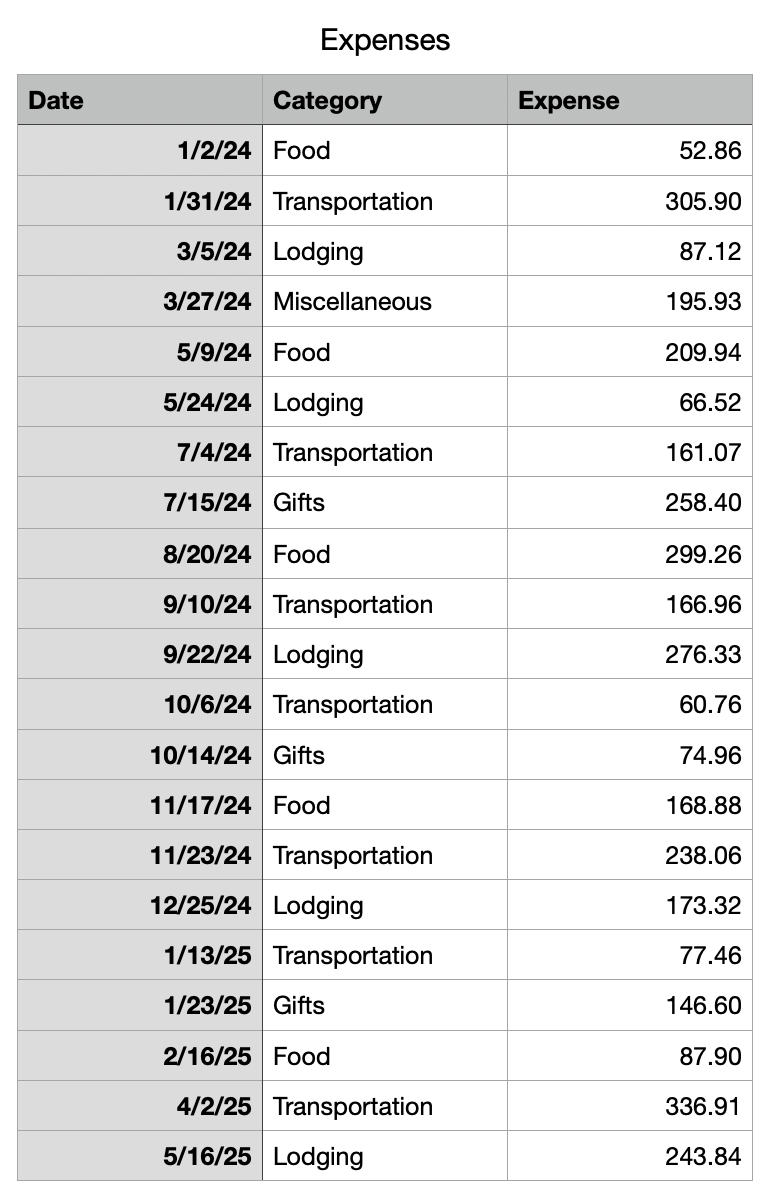
For example, I created this dummy table of expenses:
Then, with any cell in the table selected, use Organize -> Create Pivot Table
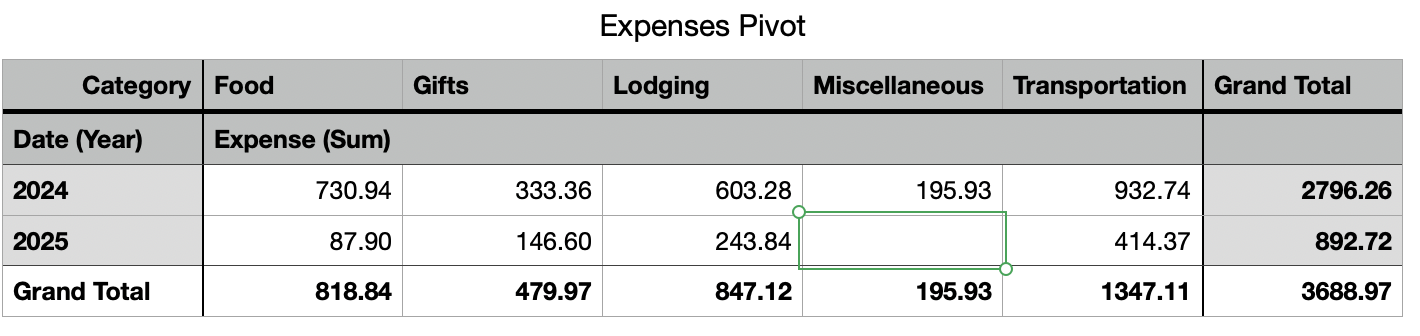
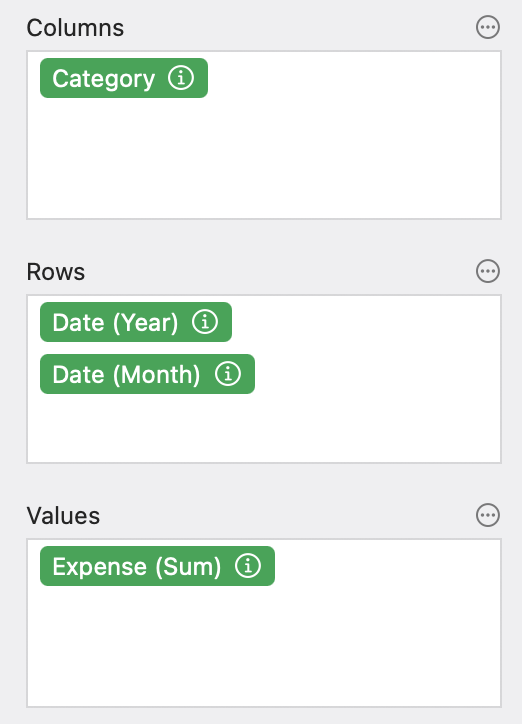
Then tell Numbers how you want to slice and dice your data.
For example, If I set:
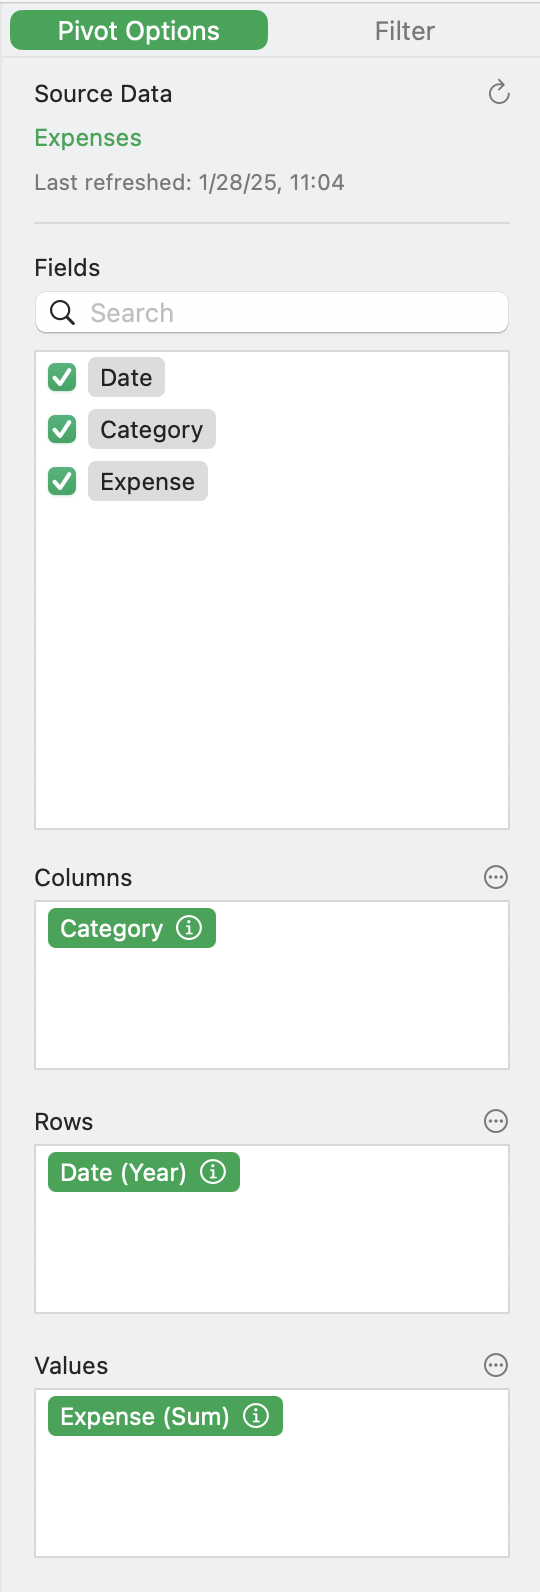
You can see I'm asking for the Categories in the columns, with dates (grouped by Year) in the rows, and the sum of values in the grid, and I get:
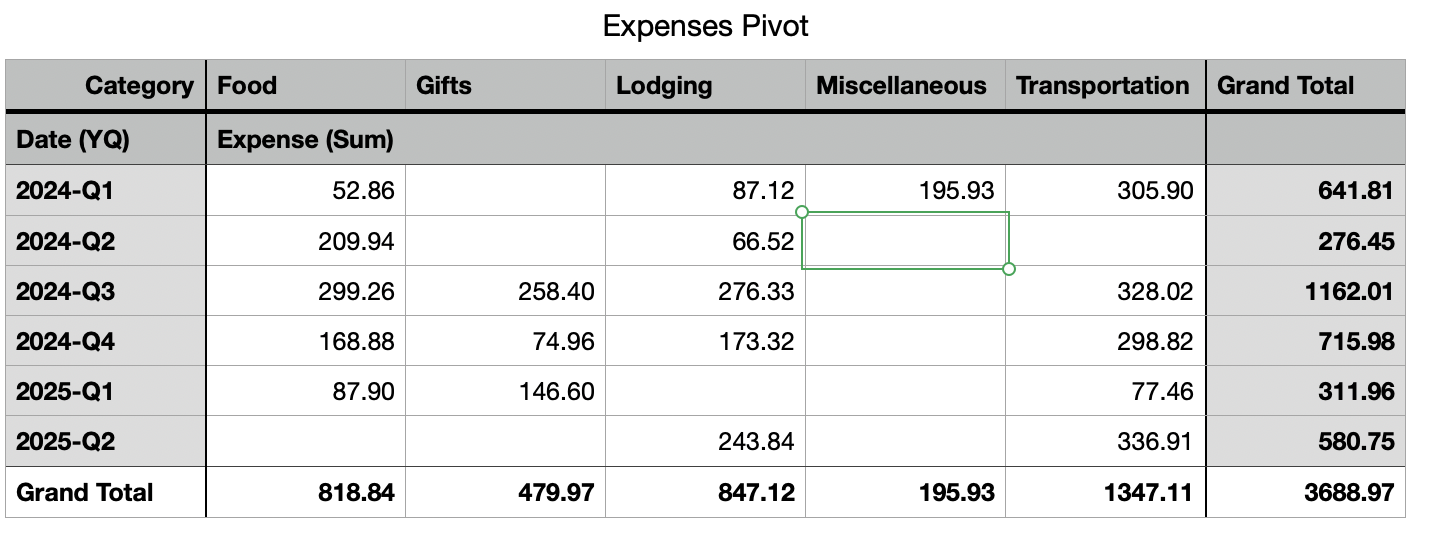
Maybe I prefer quarterly expenses. Click the (i) button next to the Date (Year) label and change to quarterly:
Or maybe you prefer the data the other way around. Switch the Row and Column fields (just drag them):

Or maybe you want subtotals by month, grouped by year:
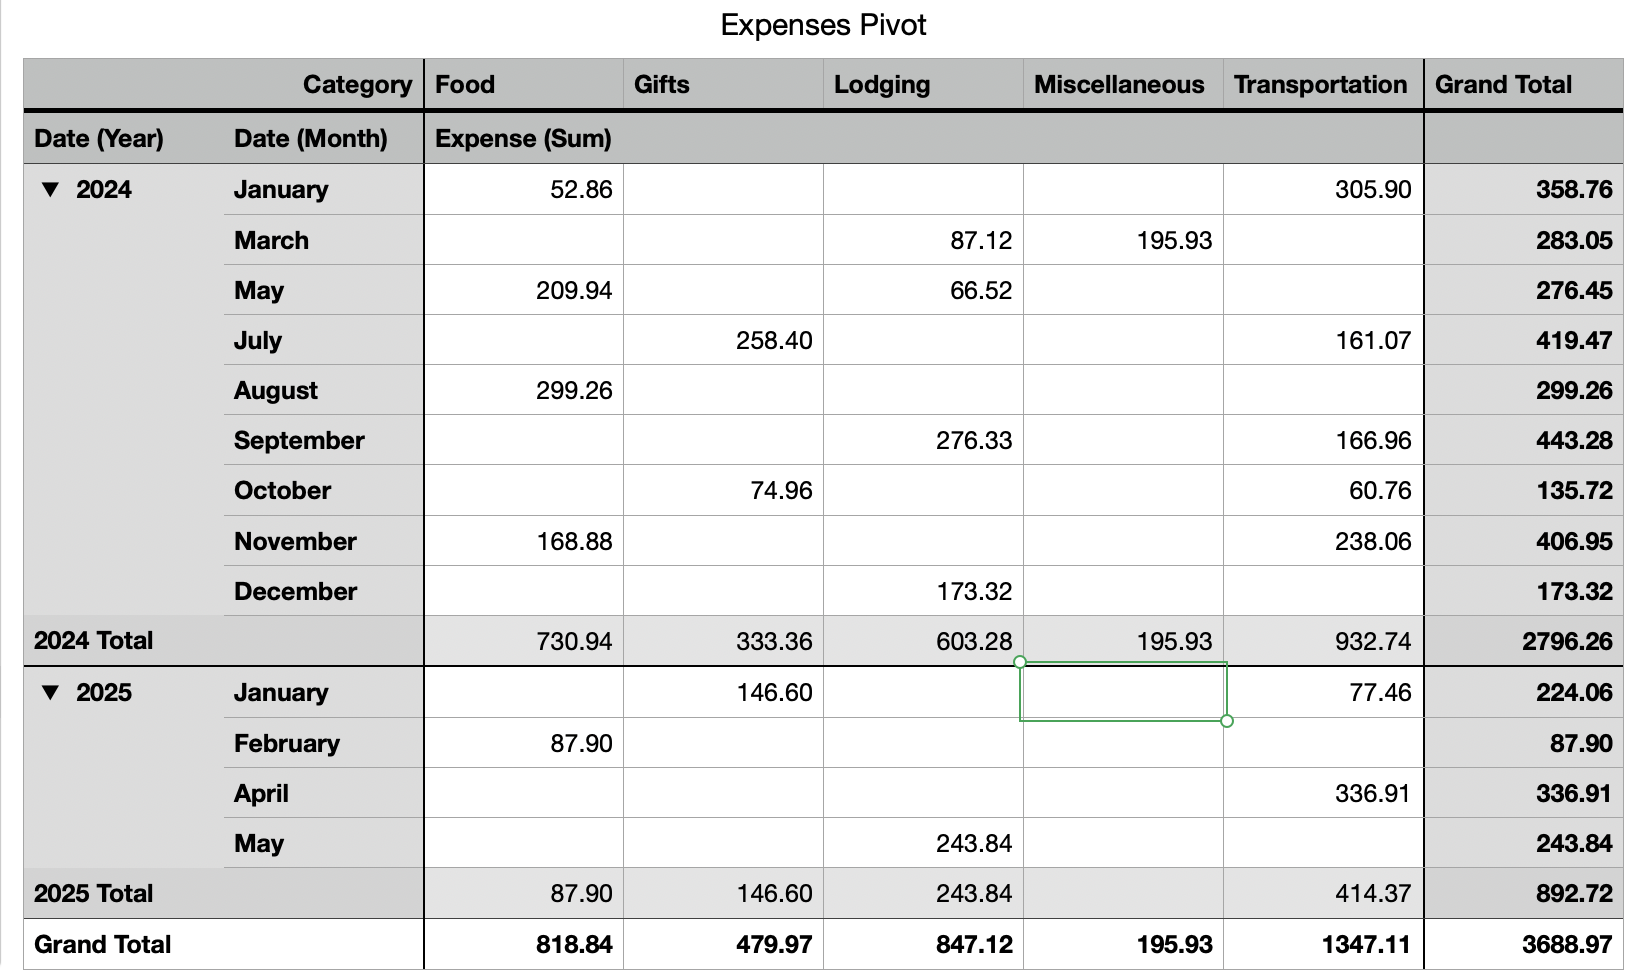
A million ways to slice and dice your data with just a few clicks.