For this kind of analysis I find Pivot Tables BY FAR the easiest. Just a few clicks and drags, starting with Organize > Create Pivot Table > On Current Sheet. Data automatically aggregates by month.
However, if you need to use formulas then SUMIFS can do the job here, something like this: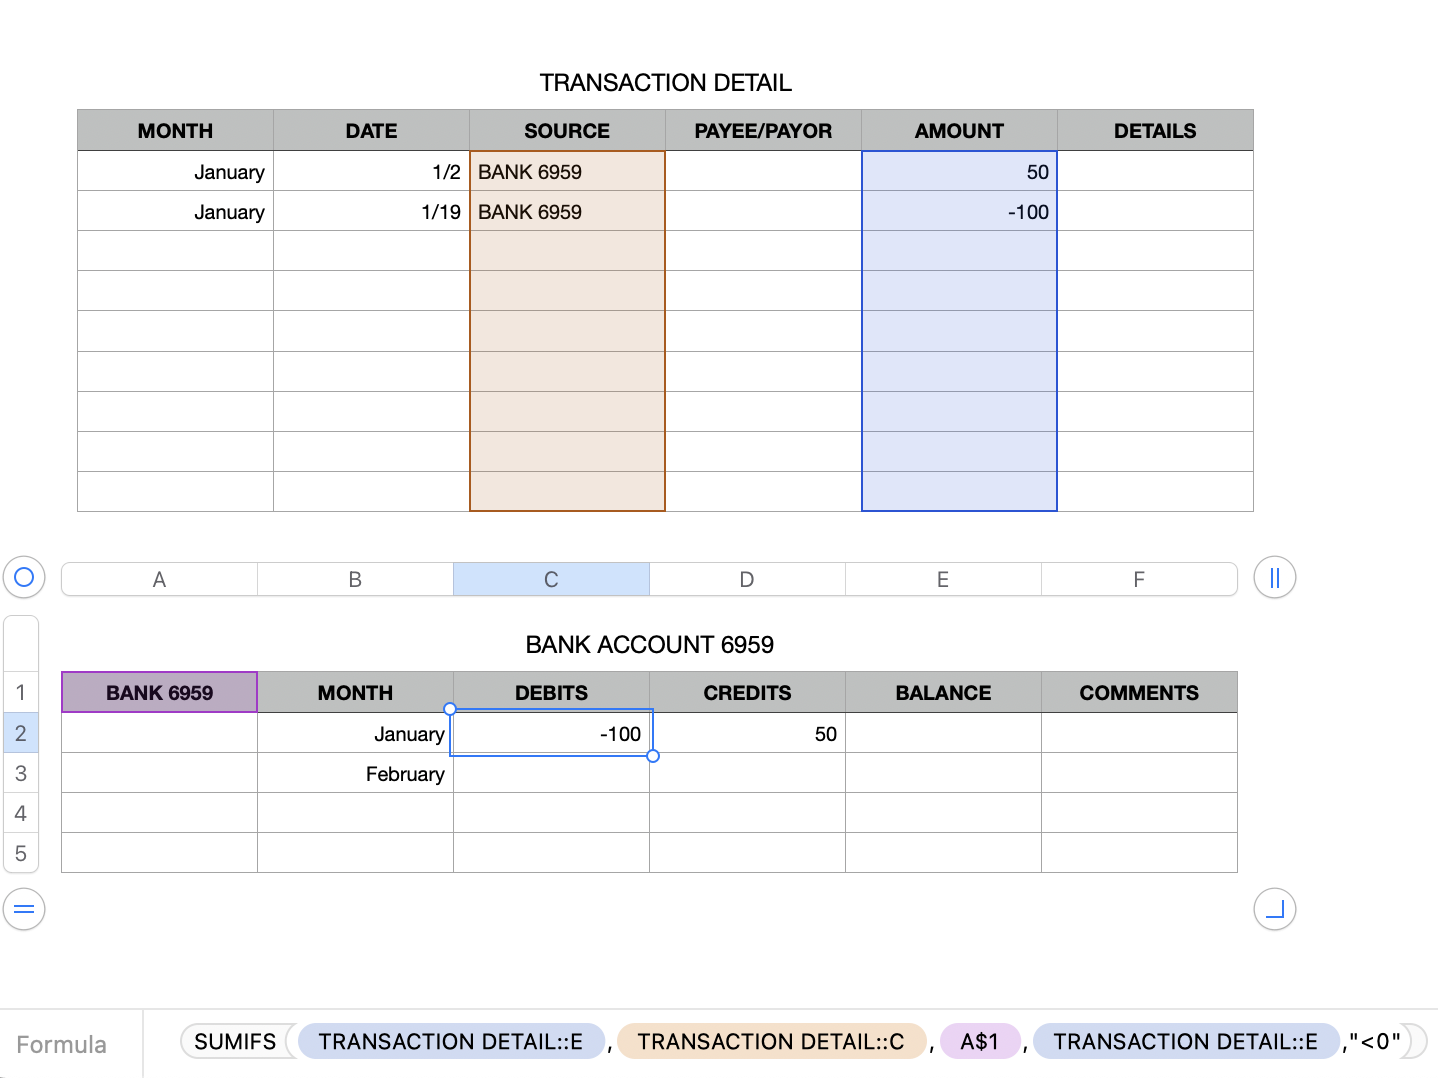
In C2:
=SUMIFS(TRANSACTION DETAIL::E,TRANSACTION DETAIL::C,A$1,TRANSACTION DETAIL::E,"<0")
In E2:
=SUMIFS(TRANSACTION DETAIL::E,TRANSACTION DETAIL::C,A$1,TRANSACTION DETAIL::E,">=0")
Replace , in the formula with ; if your region uses , as the decimal separator.
SUMIFS works with test-values, condition pairs. You can add more pairs as needed.
Note that typing January, etc. in a cell actually results in a date-time value that includes a year. If you are going to use these across multiple years you might want to enter the month name as Text. Either reformat the cells as Text or simply type ' before entering the month name.
More on SUMIFS here:
SUMIFS - Apple Support
Information on Pivot Tables here:
Intro to pivot tables in Numbers on Mac - Apple Support
SG