Unfortunately, IMO, this is where Apple went wrong with the Personal Budget template.
While it works well for what it does, it lacks the polish for things like date filtering. Granted, that would make it more complicated but that's often what people need.
So to answer your question you have to decide what's most important for you.
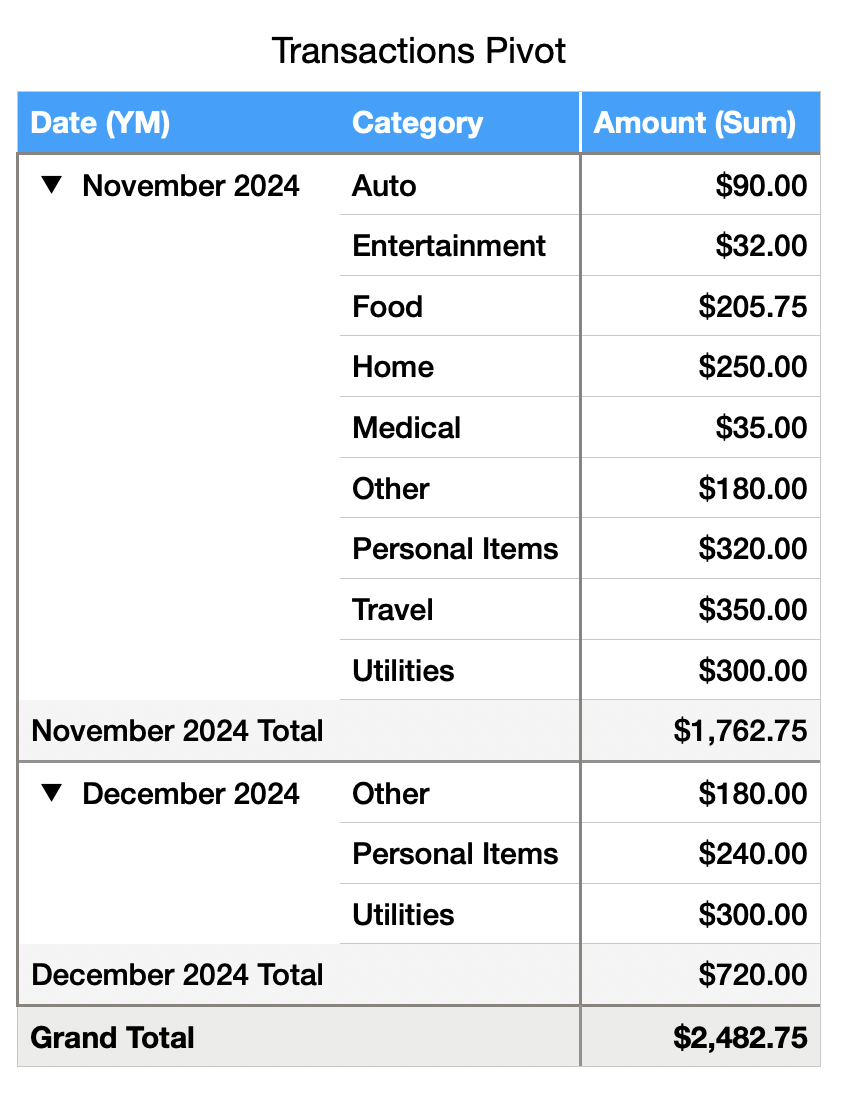
In my case, I like the Pivot Table option which makes it simple (literally three clicks) to get a breakdown of category spending by month. However, this makes it hard to incorporate the budget/difference calculation and, potentially, the charts, so if those are what's important to you then it may not be the best approach.
Another option involves added a Month header to the Summary table where you select a month and it limits the table to that month. This can work well for a single month-at-a-time view, but makes trending over multiple months hard to see.
There are also other ways of slicing and dicing the data. It all depends on what you want to get out of it. Many options will involve adding additional fields to the Transactions table to help categorize and filter the data.
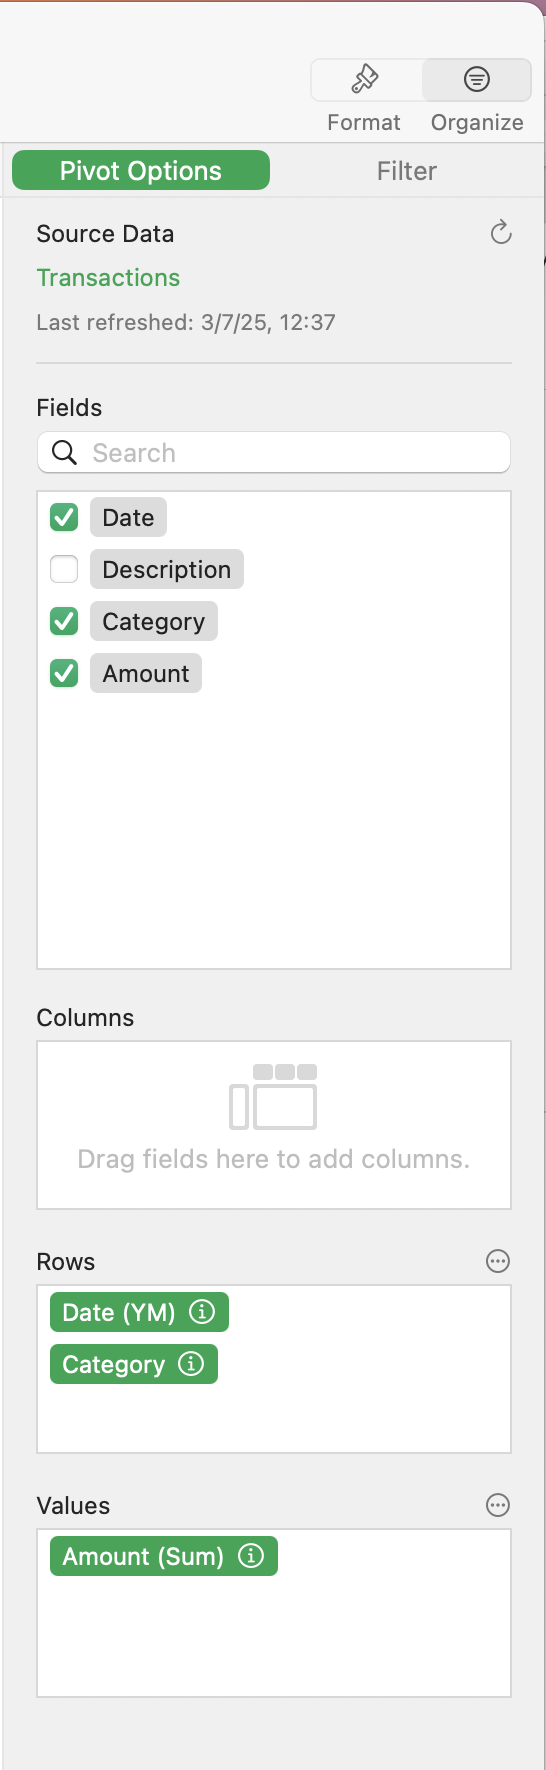
Here's an example of the Pivot Table approach:
From the Transactions Table, just select Organize -> Create Pivot Table and set it up as follows: